Work / VisualCue
Every new client was a new one-off project
Every implementation required a lot of custom work, which made the product expensive and difficult to scale. The goal was to turn that process into something repeatable — giving customers enough control to configure the platform themselves, without having to understand everything happening underneath it.
The product worked well once it was implemented. The problem was getting it there
Every new client required a significant amount of custom work from our side. The team had to build the visual elements, prepare the data, and adapt the implementation to each customer's environment. That made the product expensive to deploy and difficult to scale.
The goal was to move that work into the product itself — making the platform simple enough for a customer to configure, while still giving them access to a system that was genuinely complex underneath.
A highly customized visual language
VisualCue represented data through highly customized tiles, combining icons, colors, and layouts into a visual language that was powerful, but difficult to reproduce.
The same customization existed underneath the visual layer. Data had to be prepared before reaching the platform, and even simple data calculations required custom development outside the product.
As VisualCue moved toward the call center market, the product evolved into CueFit — and its visual language needed to become more focused and repeatable.
From custom tiles to a repeatable visual system
The original visual language was redesigned around a consistent structure. The same underlying system could now be reused across different projects, while still allowing each tile to reflect the data it represented.
Grupo NGN acquired CueFit and the team behind it. We then began shaping the product into what would become NGN Insights.
The visual system became part of the product
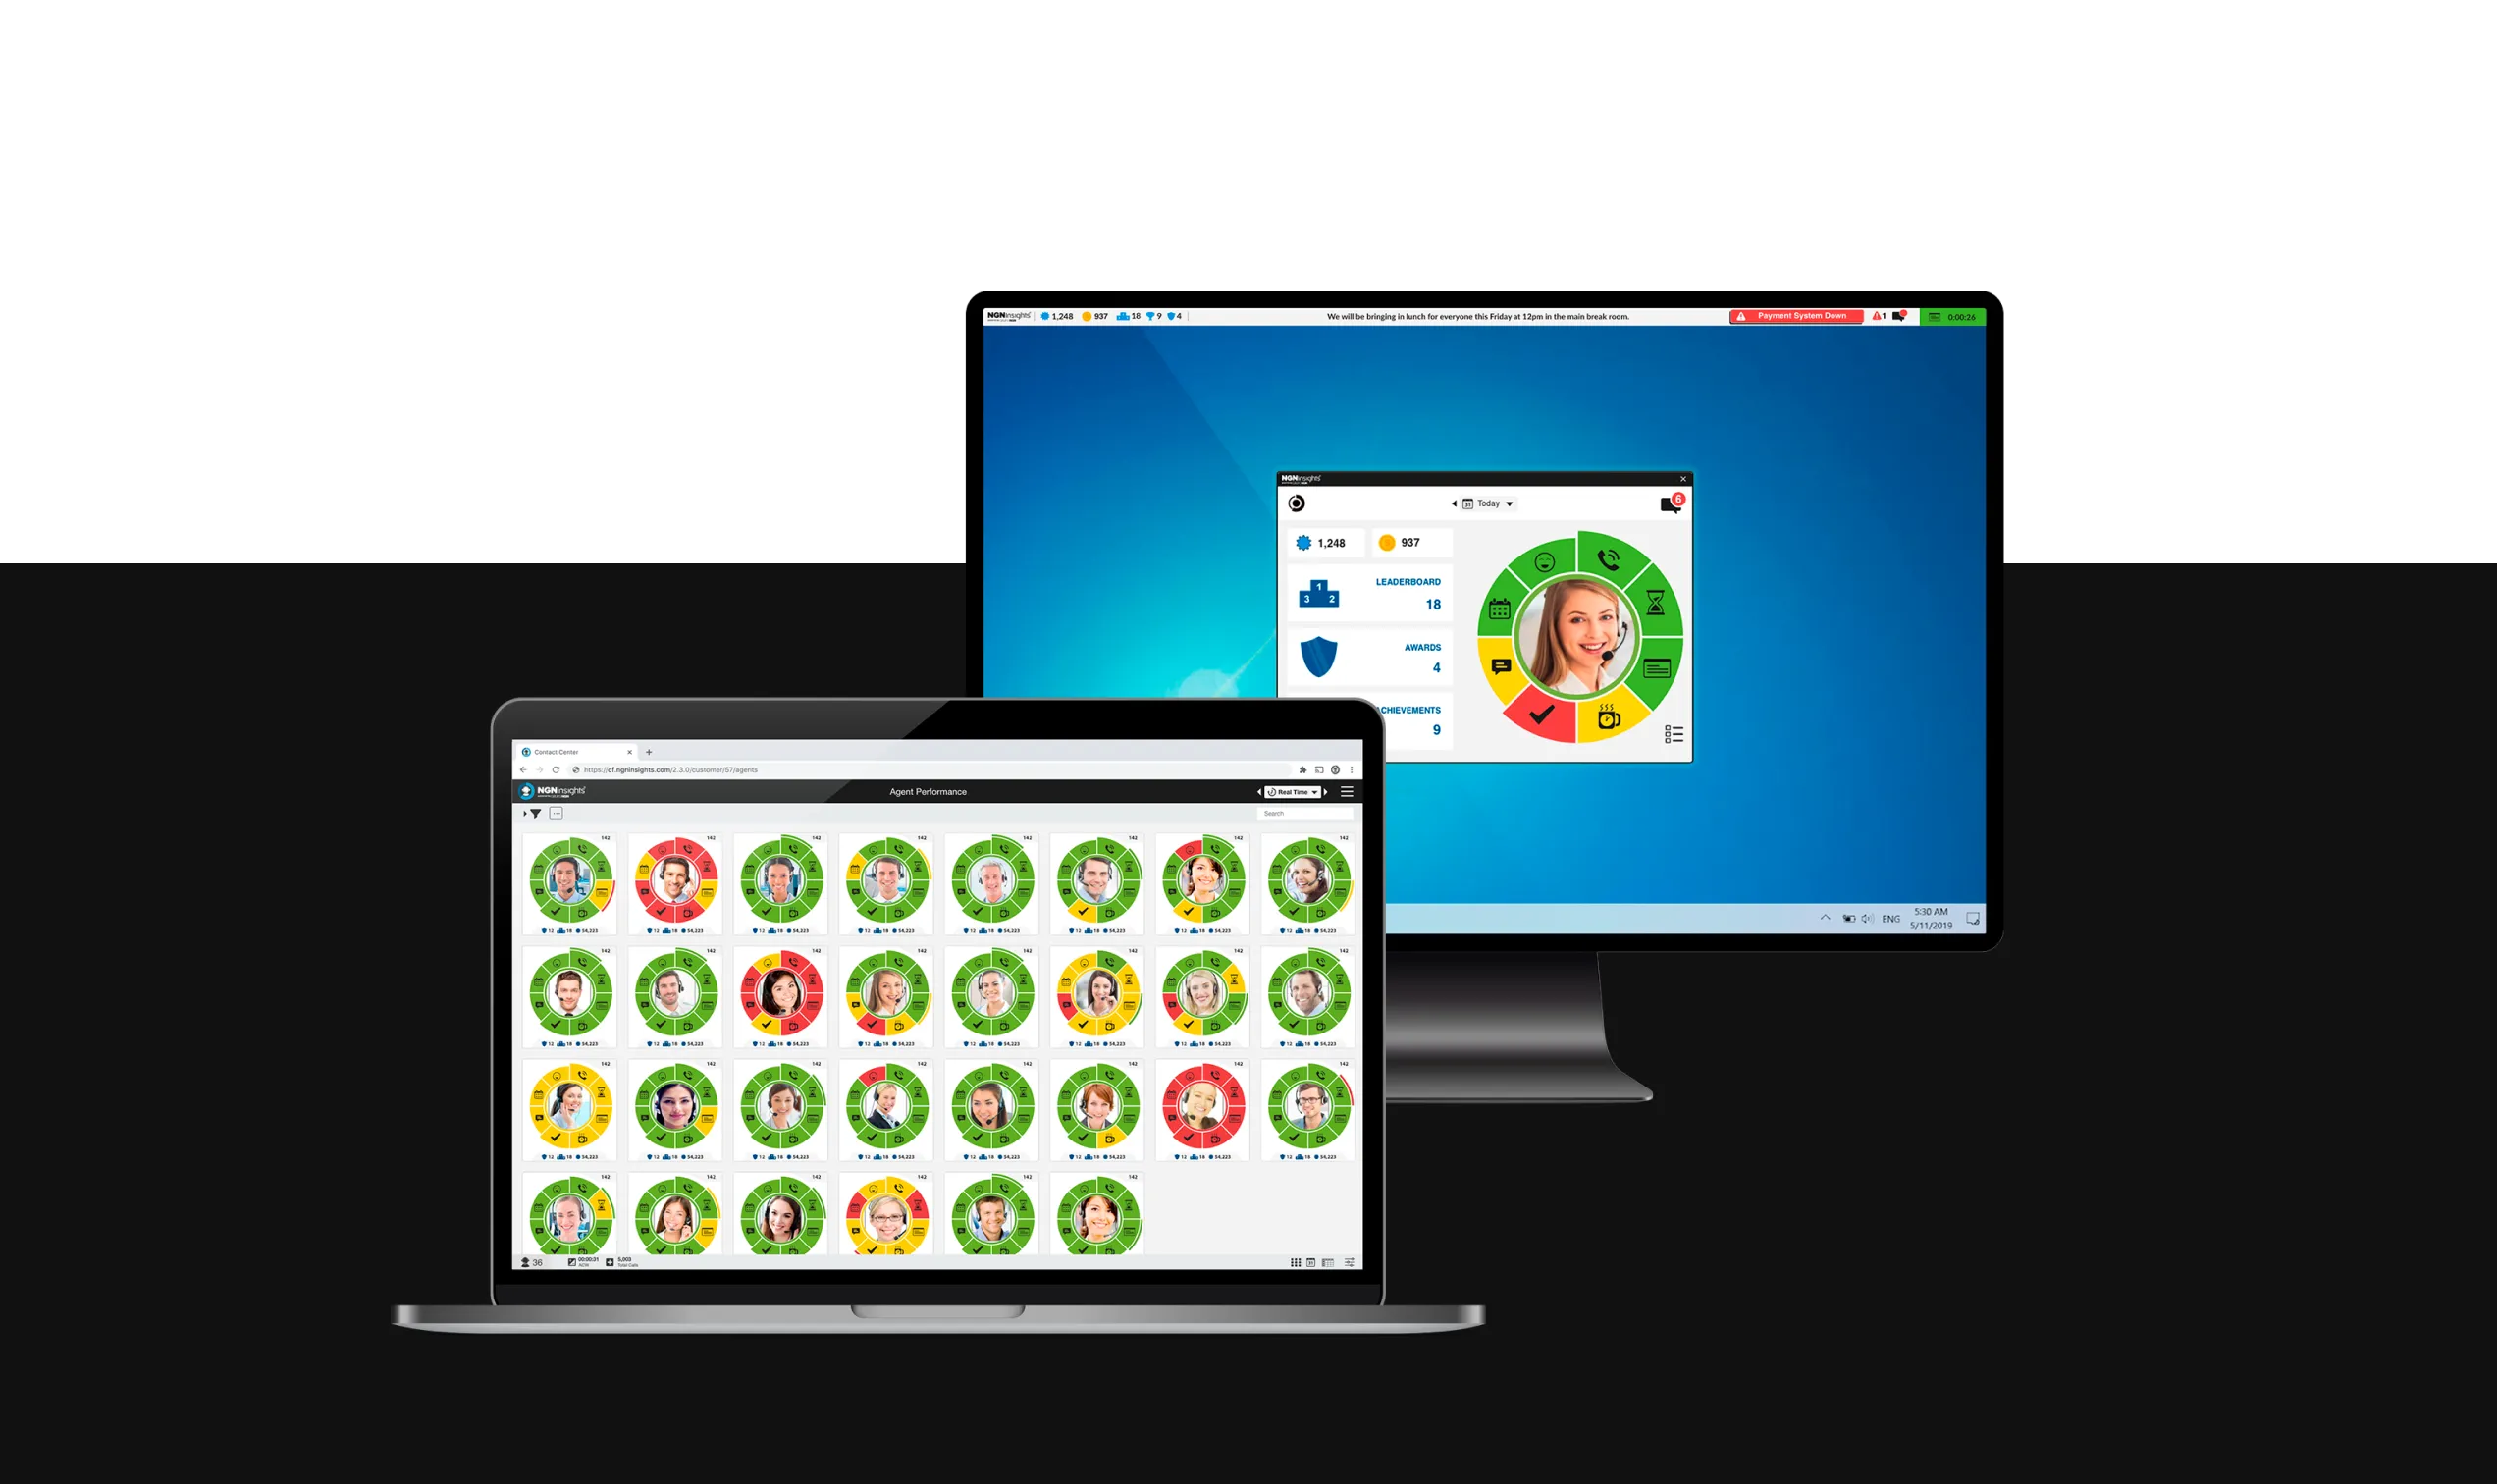
As CueFit became NGN Insights, the visual system moved into the product itself, allowing users to create and configure their own tiles directly in the platform.
Making data work simpler
What once required custom development could now be done visually inside the product. Data could be connected, combined, and transformed through an interface designed to make the underlying logic accessible.
The agent screen became part of the product
Agents could see their own performance in a much richer way in NGN Insights, with real-time information, context, and feedback built into the product.
Integrated Ecosystem
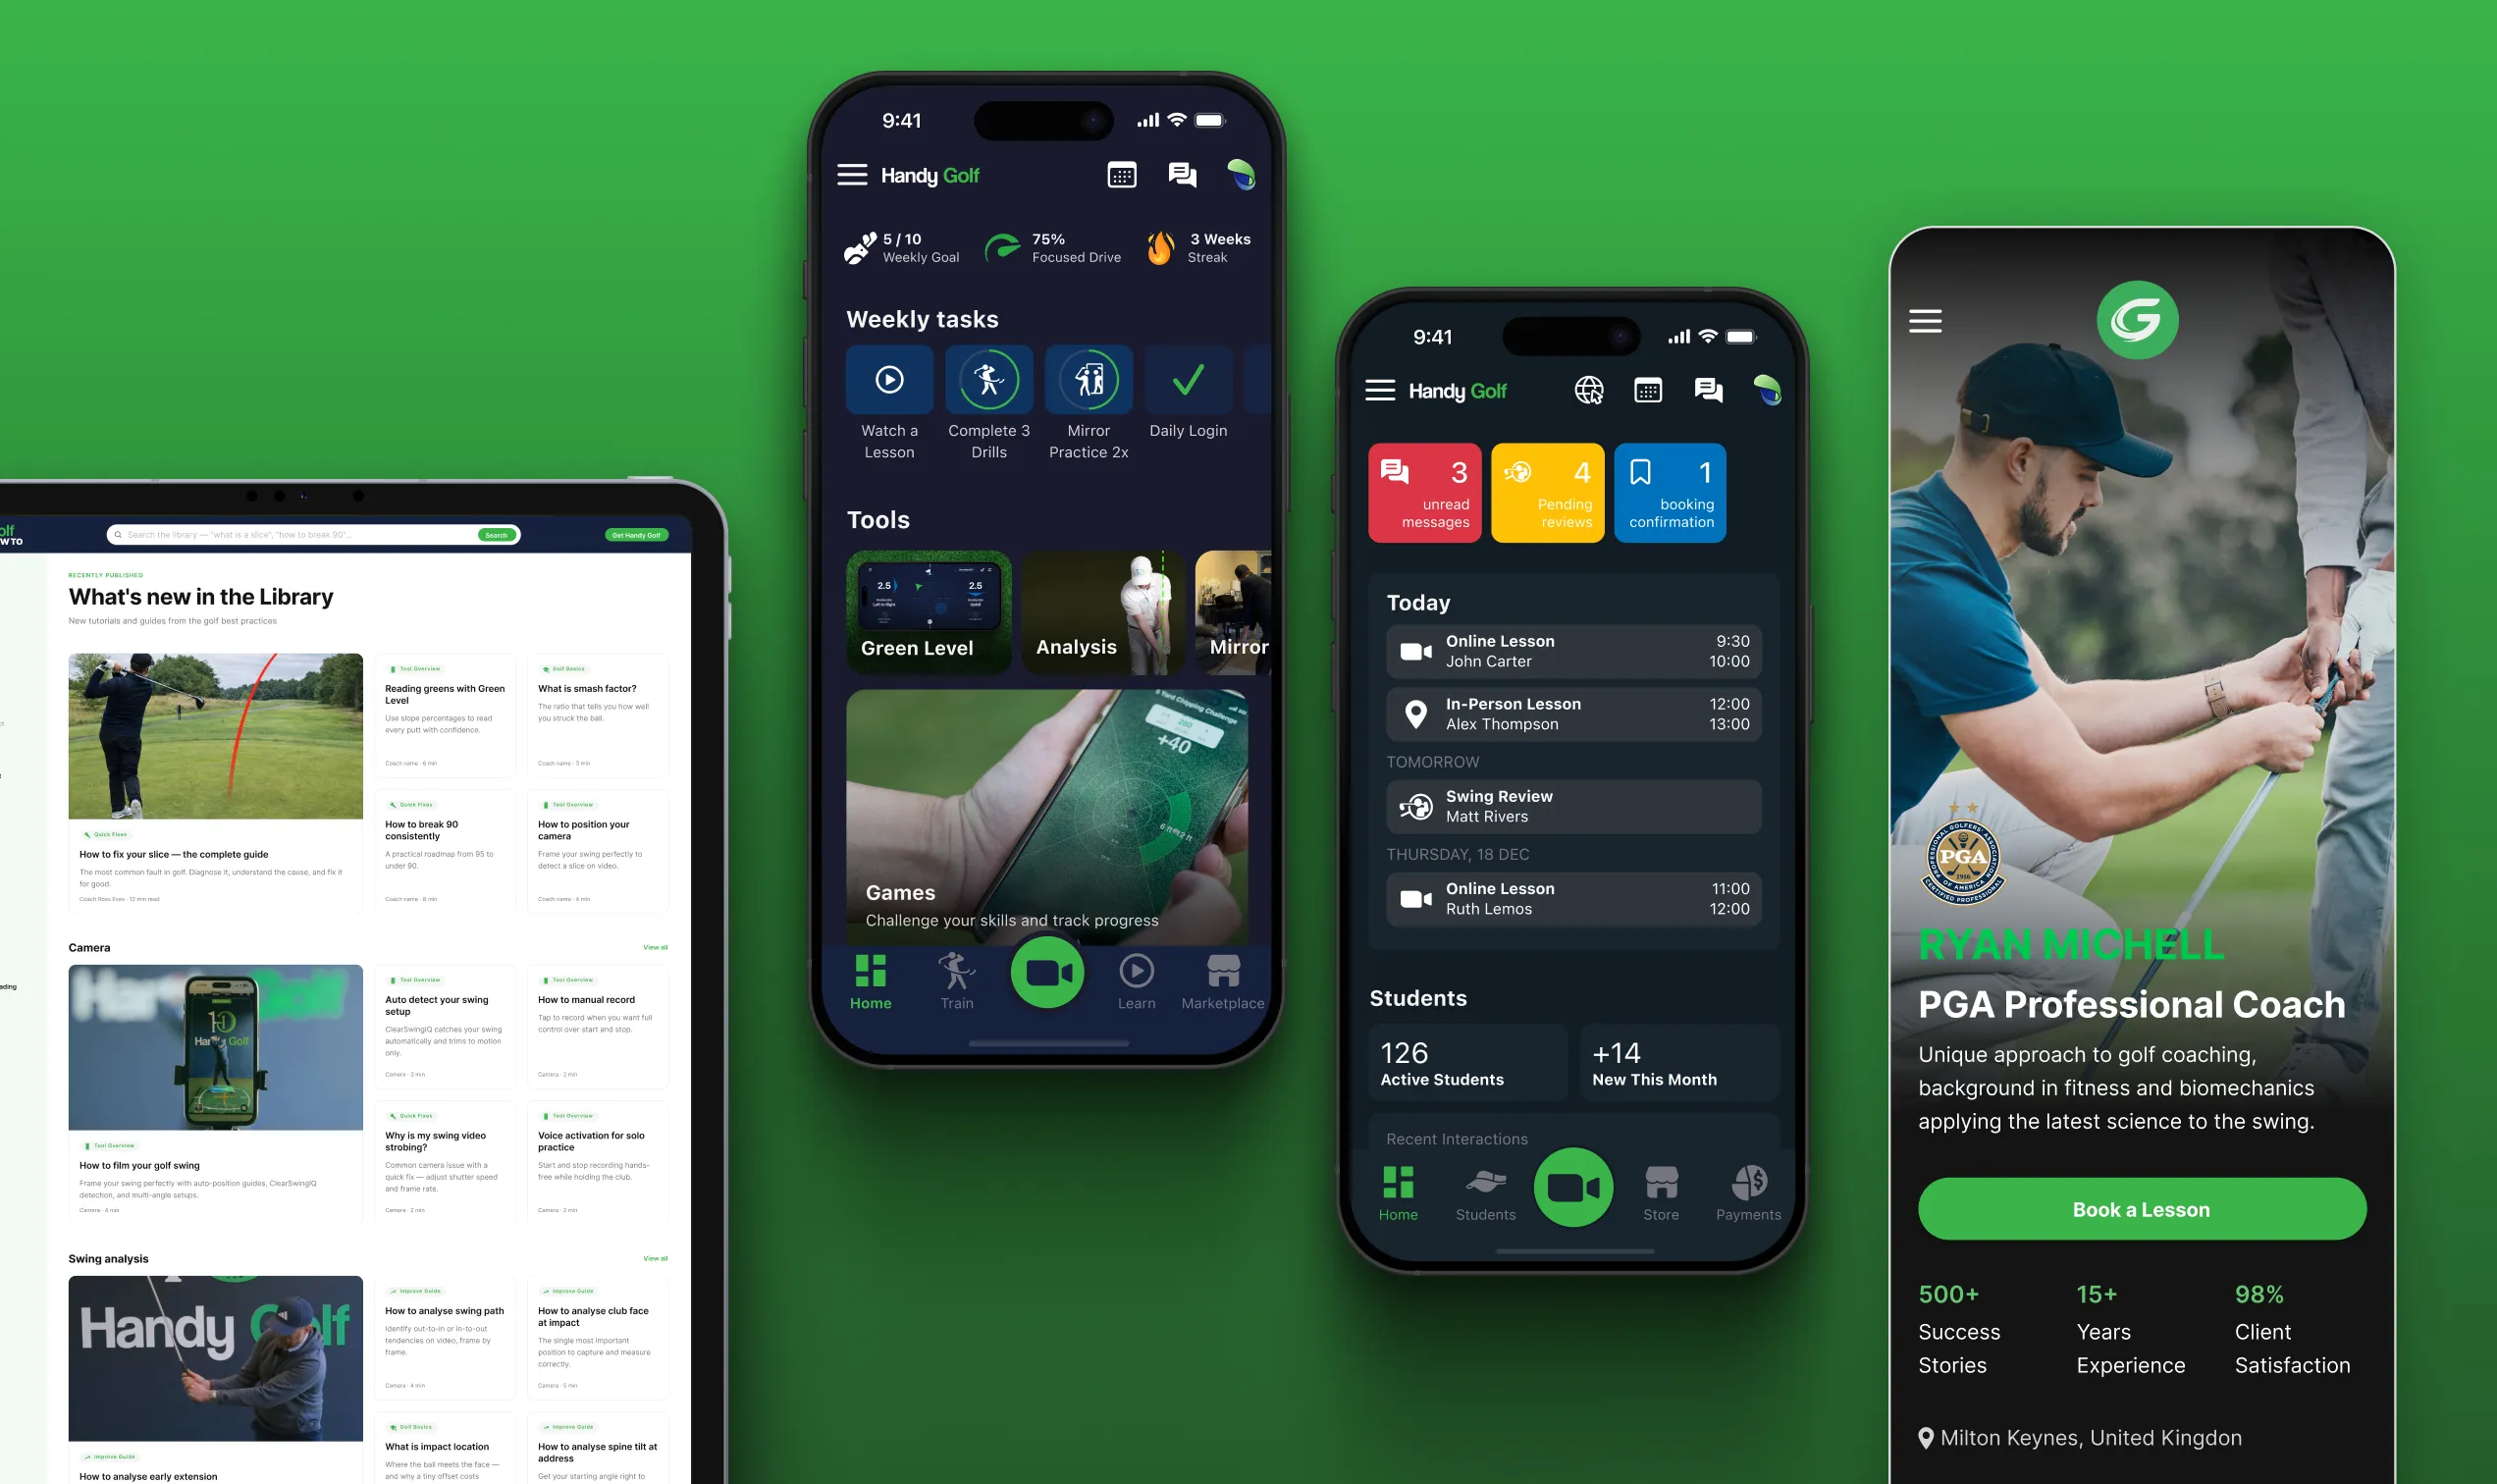
Handy GolfWhat started as a relatively small golf product expanded into apps for golfers and coaches, a content library, and coach website templates. I designed the different parts as they emerged, keeping them connected across platforms, audiences, and visual themes.
View full case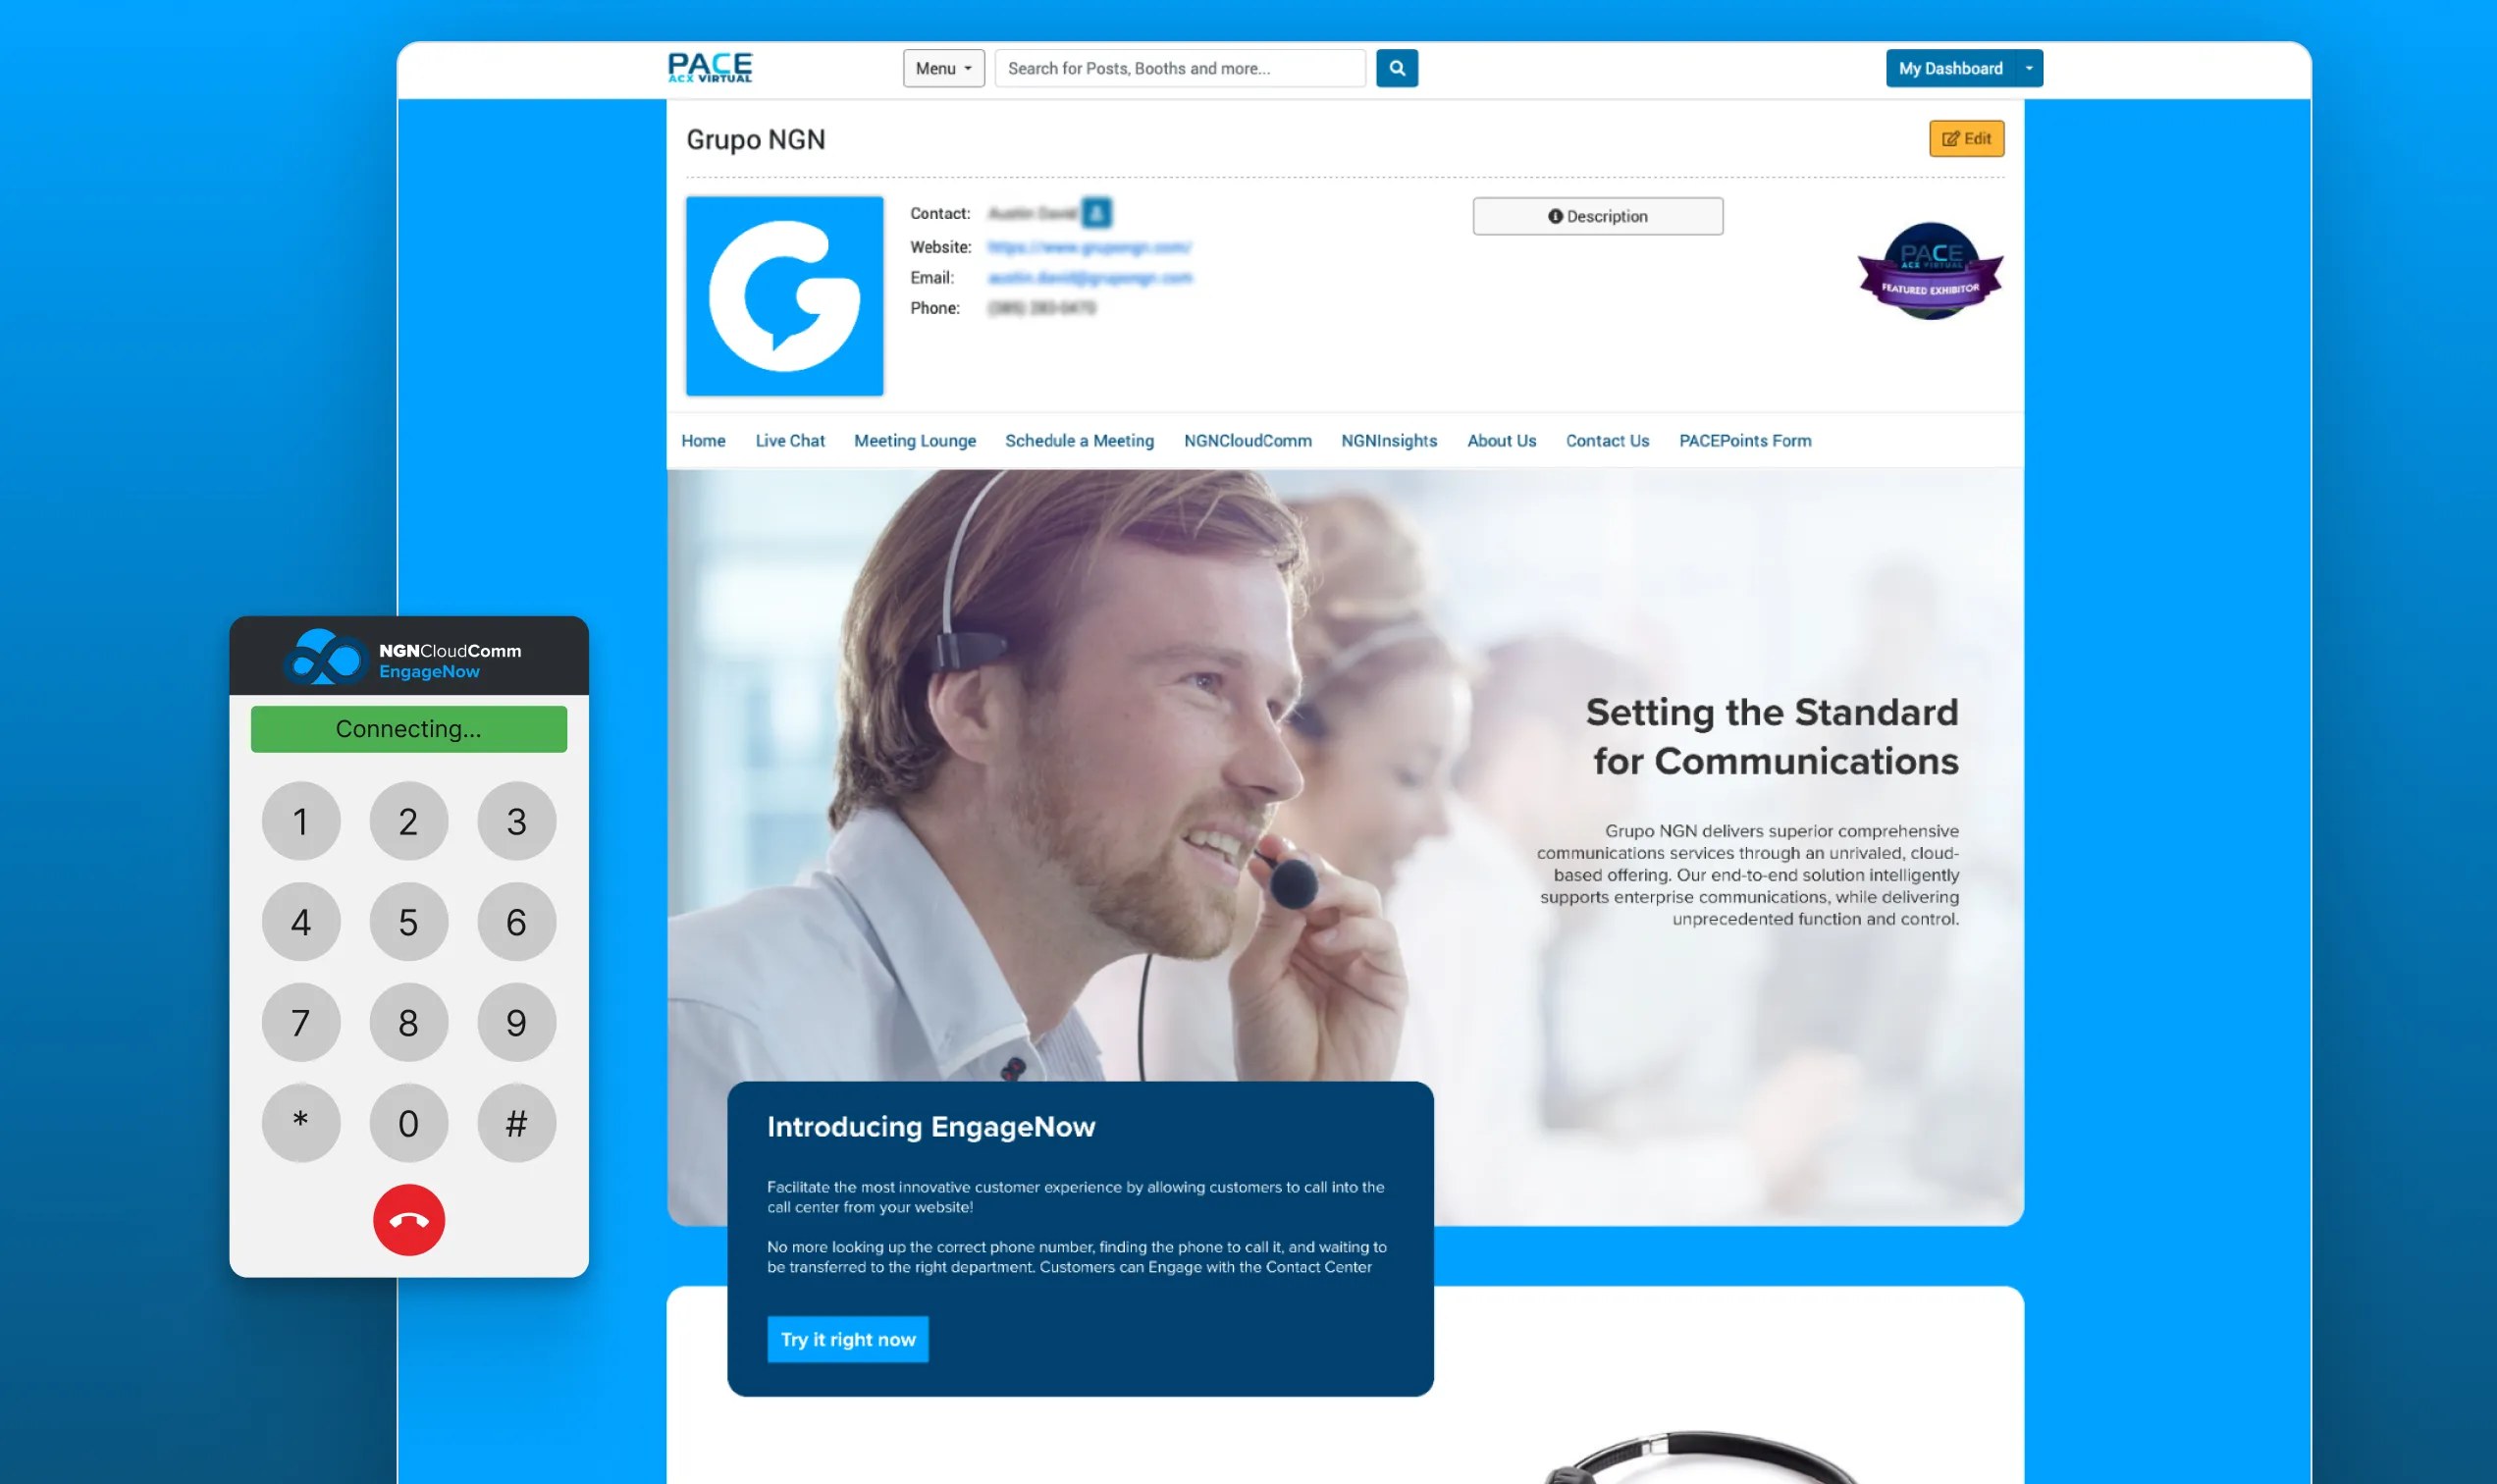
Problem Solving
Grupo NGNThe platform provided by the event organizers was built for images and text. We wouldn't be able to bring the interaction we most wanted to the booth — EngageNow — until I discovered that its rich text field would render raw HTML. That small opening changed what the booth could become.
View full case